AI Chart Maker – Turn Your Data into Clear Charts
Create clear, easy-to-understand charts with the online AI Chart Maker. Enter your data or describe your idea, and use AI assistance to explore suitable chart types for school projects, business reports, presentations, and data analysis.
Key Features
Create Charts from Data
Provide your data and use AI assistance to organize it into a suitable chart.
Multiple Chart Types
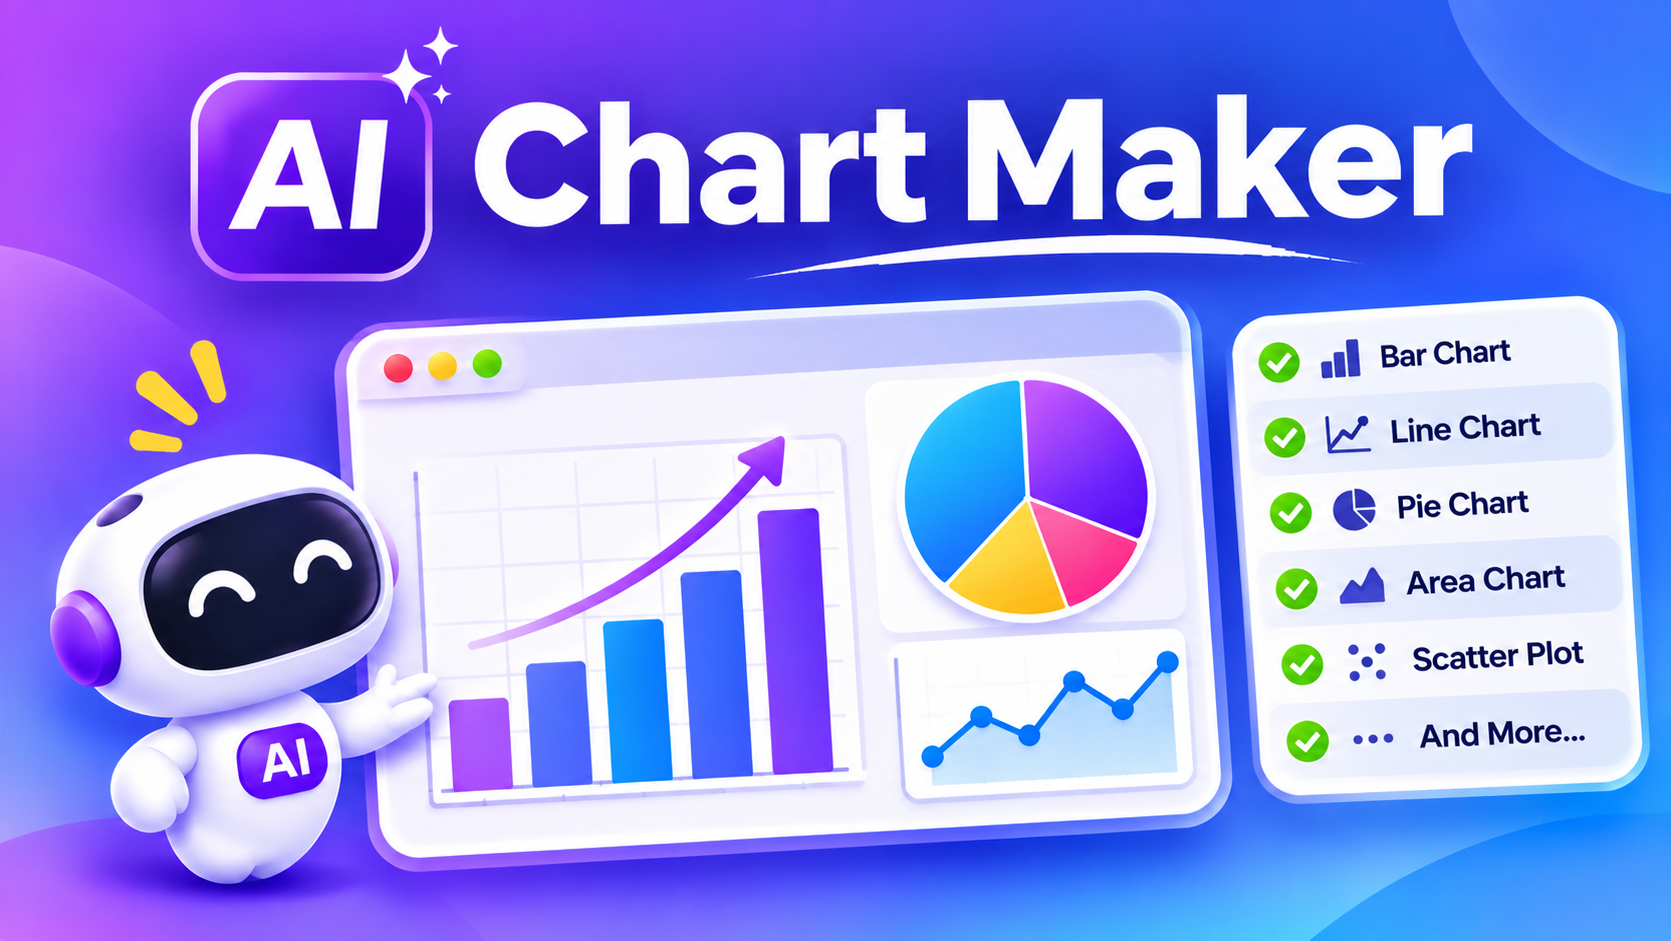
Explore different visual formats, such as bar graphs, line charts, pie charts, and other supported chart types.
Understand Data Trends
Use visual representations to explore increases, decreases, comparisons, and patterns.
Simplify Complex Information
Turn large sets of numbers into visuals that are easier to understand.
Support for Reports and Presentations
Prepare charts that can help communicate information in projects, reports, and presentations.
Easy to Use
Describe your data or provide the information you want to visualize.
How to Use the AI Chart Maker?
- Open the AI Chart Maker.
- Enter or upload your supported data.
- Describe the chart you want to create.
- Choose a suitable chart type if available.
- Generate and review your chart.
- Check that the displayed values match your original data.
- Export or download the chart if the feature is available.
Who Can Use an AI Chart Maker Tool?
Teachers
Prepare visual learning materials.
Students
Create charts for assignments and projects.
Business Professionals
Present business data and reports.
Researchers
Explore numerical information.
Content Creators
Add charts to articles and presentations.
Data Analysts
Create visual summaries of datasets.
Frequently Asked Questions
What is an AI Chart Maker?
An AI Chart Maker is a tool that uses artificial intelligence to help users organize data and create visual representations such as bar charts, line graphs, pie charts, and other chart types.
Charts make it easier to compare values, identify patterns, understand trends, and communicate information.
Which chart types are available?
Common options include bar charts, line charts, pie charts, doughnut charts, area charts, and scatter plots, depending on the implementation.
Can I use charts for business reports?
Yes. Charts can help present comparisons, trends, and other important business information.
Can I download the generated charts?
Download options depend on the chart tool’s enabled export features.
Is AI chart generation always accurate?
AI can misunderstand data or create incorrect visualizations. Always compare the chart with your original data before using it.